Recommendation engines battle - part II.
Custom engine vs. Amazon Personalize
- Lukáš Matějka
![Lukáš Matějka]()
- 6 min read

In the previous part of the article we introduced the main problem and our goal. We wanted to introduce individualized recommendations in e-commerce domain for specific use case for product comparator where user enters a category and browses list of items on a product listing page. We used both next-generation recommendation engines (Amazon Personalize and Zoe.ai Deep Recommendation) for result comparison.
In this part we’re going to describe more details about the experiment itself. What kind of dataset has been used, discuss its specifics and characteristics, which performance metrics have been chosen for final comparison, show final results and in the end, present final conclusions.
Datasets
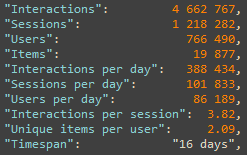
For this experiment we’ve selected a few datasets, basically, they differ only in a number of days used for training (taking longer or shorter history for training). For simplification, in this article we use a dataset with 16 days. In a complete experiment 16, 30 and 60 days have been used, however, we can observe similar conclusions for all datasets along with increasing metrics performance with more data used for training. Let’s see basic statistics about the dataset.
Basic dataset statistics
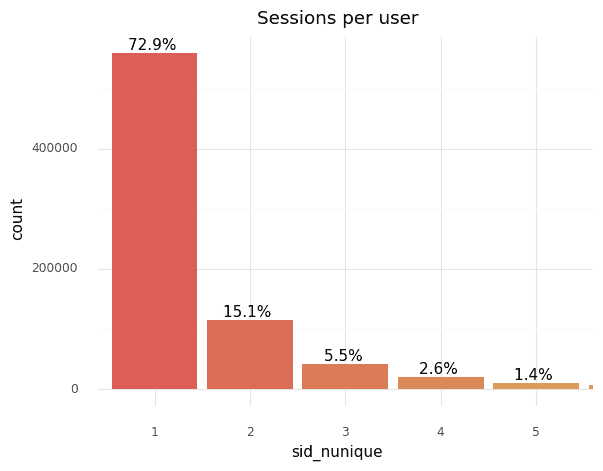
As you can see, there is a quite high number of users interacting with items in the dataset. The average number of interactions in the session is relatively low, but we have to consider specific behavior in terms of a product comparator. For instance, many users go directly from a search engine and check the product detail and then leave. Moreover, there are many repetitive returns back to the site in a short timeframe from group of users having more sessions. On the other hand, many users with no previous visit occur in the dataset what can be seen on a chart with number of sessions per user (which could be also a downside of using cookies, especially browser Safari does not allow longer cookie lifespan). The sparsity of the dataset is approximately 96,9%.
Number of sessions (sid) per user
Most users visiting the website are anonymous, therefore users in context of this dataset are identified by web cookie. Also, the website has burden of many bots and crawlers, so before experiment starts, the dataset needs to be cleaned carefully. Bot and crawler behavior is not appropriate for training and in principle, we would like to get rid of it.
Dataset is split into train and test parts in order to train engines and evaluate them afterwards on unseen data. We used one of the standard train-test-split strategies, split by date , i.e., last 4 days from the dataset was used as a test part.
How to measure performance?
Measuring performance of a recommendation system is a tough challenge. There is no single number that can say whether recommendation is good or relevant enough or not. In general, we have to look at many metrics and consider them all together in order to be able to interpret a “good” recommendation. Performance metrics can be divided into two categories. First, accuracy metrics are focused on expressing how algorithms are precise in recommending items seen by users in test and how good they are in their ranking (offering the most relevant as first). The latter, beyond-accuracy metrics are focused on more “soft” areas of recommendation — for instance, how diverse and innovative recommendation are, or how long-tail items are being recommended and discovered to user.
This performance measuring challenge is so difficult also from another reason. It has one big limitation that need to be considered. Performance is evaluated from already collected data. In real A/B test there is a direct influence of recommended (presented) items to user and his consequent behavior. Users, in general, have tendency to click on first positions of recommended item lists and logically don’t click on items that are not on the list at all. However, performance metrics are still a very good indicator of how recommendation systems will work in real A/B test. But there is no guarantee that you really achieve the same results.
In our evaluation system we use many performance metrics, for simplification, we use only a few of them here. Each metric has several ranks represented by @k meaning metrics are being counted for the first k recommended items. If we try to translate it, this could be important when evaluating how many items you show to users. Simply said, some systems could be better in recommending 5 items, some for 25.
Experiment
We have to add also several things here to be comprehensive. For this experiment we use the real-world dataset, results achieved on this dataset do not necessarily mean same results will be repeated with different data. Also, data are coming from specific behavior of product comparator, which slightly differs from typical e-commerce flow. In addition, it should be stated that our own engine can be configured as we know how it works under the hood. In comparison with Amazon Personalize where it was used as a black-box service with its public API (where a few hyper-parameters can be tuned, we basically used default configuration).
Results
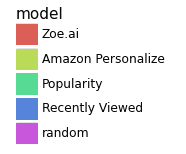
To be able to compare results and show how individualized approach works, we add more models into evaluation. We call them baselines. First, Popularity is a simple model displaying globally the most viewed products (=popular). It’s a global model and thus provides the same results for all users. Second, Recently Viewed model offers the last viewed items that user visited. This is also a simple model, but it is not global and offers individual items for each user (having some viewing history). Third, Random model serves random items for each user. As a result, we compare 5 models — Zoe.ai, Amazon Personalize, Popularity, Recently Viewed and Random, depicted with following colors.
Recommendation models used in evaluation
In following charts only a few performance metrics have been selected. Based on our observations, we consider a significant difference in metric value when differs more than +/-0.003. This is caused by various training runs that can differ in initial random values (seed cannot be used over external recommendation system). Now let’s have a look on metrics and results.
cum_hit_rate@k — cumulative hit rate is a cumulative sum of hit_rate metrics. It means how good our top-N recommendations are, how many recommended items were seen in the test for a particular user in total.
cum_hit_rate@k
As we can see there, individualized models outperforms baselines significantly. Random model due to expectations has very low cumulative hit rate and moreover Zoe.ai highly outperforms Amazon Personalize. We can also see that performance is going higher with the higher rank, as there is a higher probability to do a hit. Recently Viewed model does not follow that, there is a simple explanation, model has no data to show as users don’t have enough viewed items.
ndcg@k — normalized discounted gain means how precisely are results sorted, how much presented recommended items lists differ from ideal sort, (e.g., the detailed explanation can be found https://towardsdatascience.com/evaluate-your-recommendation-engine-using-ndcg-759a851452d1)
ndcg@k
The same result was achieved here, individual models are better in sorting recommended lists over baseline models.
MRR@k — mean reciprocal rank counts first relevant item ranks in recommended lists, i.e., showing how good recommended list is from a point on which position is the first relevant item (https://machinelearning.wtf/terms/mean-reciprocal-rank-mrr/)
nMRR@k
As you can see, Zoe.ai and Amazon Personalize achieve very similar results here, so both are able to put similarly first relevant item in recommended list. Baseline models have significantly worse metrics.
coverage@k — says how good is a model in recommending diverse set of items. Typically, Popularity model is logically very weak at it. When coverage is equal to 1.0, it means every item from item set was recommended at least once.
coverage@k
As you can see, Random model achieves maximum value 1.0, which is logical as model chooses randomly items from the whole list. In contrast, Popularity model is logically very conservative here and achieves very low numbers (offers always same results for each user). Moreover, Zoe.ai outperforms Amazon Personalize here significantly and offers higher diversity in recommended items. This can be very beneficial in a long-term context for both company business and its revenue: users won’t be bored by recommendation of still same items but will be positively surprised and satisfied by new ones.
Conclusion
Seen on previous results, individual recommendation systems significantly outperform baseline models as Recently Viewed or Popularity models (e.g., increase ~ 62% on cumhit_rate@10 against _Popularity), moreover Zoe.ai Deep Recommendation outperforms Amazon Personalize in all metrics (increase ~ 37% on cum_hit_rate@10).
Generally, as dataset has a high number of users without any previous visit history, there is also a good reason for using recommendation systems than can take into account actual behavior (session behavior) and adjust recommmendaiton based on that (what next-gen systems like Zoe.ai and Amazon Personalize represent).
For comparison we used performance metrics, which is a good indicator of performance. However, this won’t replace a real A/B test where you track business metrics that should be improved by individual recommender system.
Did you have fun reading it?
Let's talk about it more!
Prague
Aguan s.r.o.Kaprova 42/14110 00 PrahaCzech republicIN: 24173681+420 222 253 015info@lundegaard.eu
Prague
Lundegaard a.s.Futurama Business ParkSokolovská 651/136a186 00 Praha 8 - KarlínCzech republicIN: 25687221+420 222 253 015info@lundegaard.eu
Brno
Lundegaard a.s.Ponávka Business CentreŠkrobárenská 502/1617 00 Brno - jihCzech republicIN: 25687221+420 222 253 025info@lundegaard.eu
Hradec Králové
Lundegaard a.s.Velké náměstí 1/3500 03 Hradec KrálovéCzech republicIN: 25687221+420 222 253 015office.hradec-kralove@lundegaard.eu
All rights reserved by Lundegaard a.s.
Services provided by Aguan s.r.o.


